Holographic Interferometry

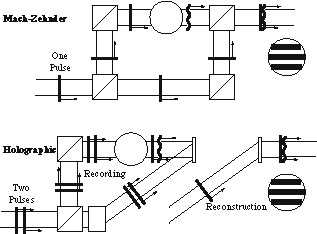
Interferometric techniques have long been used in studying flow fields. A beam of light is divided into two, with one part, the object beam, passed through the flow and the other, the reference beam, passed around. When recombined, the beams interfere providing fringes which allow visualisation and quantification of density variations in the flow. The most common layout of this format is Mach-Zehnder Interferometry as shown.
With the advent of the laser, holographic techniques have been developed whereby the two interfering beams are recorded holographically - one before flow is established and one during. See adjacent schematic. The beams are reconstructed simultaneously afterwards yielding an interferogram with the same information as the standard two beam technique. The major advantage of this method is that both object and reference beams pass through the same optics and windows. This relaxes somewhat the requirements of stability and the quality of the optical components.

The experimental arrangement for our holographic interferometry measurements consists of an injection seeded Nd:YAG laser providing light at 532 nm with a pulse duration of about 10 ns operating at 10 Hz. The light is divided into the object/reference beam which is passed through the tunnel and the recording beam which is taken around the tunnel by a periscope system and is used to form the hologram. The model is imaged onto the holographic plate through an aperture to remove luminosity from the hot test gas. To maintain power stability and seeding, the laser must be run continuously at 10 Hz necessitating a computer timing system which synchronises firing of the tunnel with the operation of the laser. This system allows recording of the reference hologram immediately prior to tunnel operation followed soon after by the object hologram. Afterwards, the interferogram is formed by illuminating the holographic plate by a sodium lamp and images are recorded on a CCD camera.
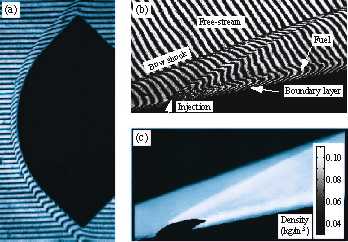
Some sample images are shown in the accompanying figure. Image (a) is an interferogram of a 10 km/s air flow over a re-entry capsule tested in the X2 super-orbital expansion tube. The bow shock around the capsule is easily identified and the shock stand-off can be determined. In image (b), the flow on the inlet of a supersonic combustion ramjet with fuel injection tested in the T4 shock tunnel is shown. The bow shock, fuel, and boundary layer are clearly seen. This image was processed to yield the flow density as shown in image (c). The measured densities are valid for all locations in the image apart from in the fuel jet seen above the inclined plate.