Two-wavelength Holographic Interferometry

To facilitate quantitative measurements where significant ionisation occurs in the flow, interferograms need to be recorded at two well separated wavelengths. Since fringe shifts due to atoms and molecules decrease with wavelength while those due to electrons increase, it is possible to use two interferograms to solve simultaneously for both total and electron densities. This has been achieved in the past in studying high velocity flows using Mach-Zehnder interferometry. Two wavelengths were combined, passed through the interferometer and then separated before recording on photographic film. The use of holographic techniques opens the possibility for a more elegant method where holograms of each wavelength are recorded on a single plate.

We have developed a new method whereby the second and third harmonics from the Nd:YAG laser (532 nm & 355 nm) are used as the two wavelengths. Both beams are passed through the optical system described above and are recorded on the holographic plate. This results in four overlapping holograms - an object and reference hologram for each wavelength. Upon illuminating the hologram with a helium-neon laser the reconstructed beams for the lower wavelength are diffracted at a larger angle than the higher wavelength so that each interferogram can be observed separately and undisturbed by the other.
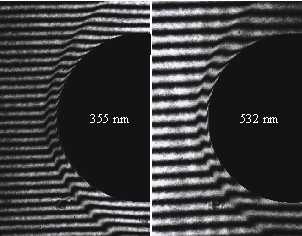
Sample holographic interferograms of a 10 km/s air flow over a cylinder recorded are shown adjacent. The cylinder, with a diameter of 15 mm and a length of 60 mm, was tested in the X2 facility. The presence of electrons in these images can be seen as the larger downwards fringe shift seen just in front of the cylinder for the 532 nm image.
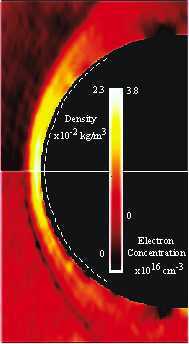
The interferograms were processed using Fourier transform and unwrapping techniques to determine the fringe shift at each point. This gave the distributions shown in the adjacent figure. In these images, the shock front is clearly seen as a sudden increase in the densities. Peak densities and electron concentrations are observed in the vicinity of the stagnation streamline.