Near-Resonant Holographic Interferometry

To study the density distribution of a particular species in the flow or to enhance the sensitivity of interferometry, a holographic form of two-wavelength spectroscopy has been developed. This technique, known as near-resonant holographic interferometry (and also as resonant holographic interferometry spectroscopy), relies on probing the variation of the refractive index of the gas for light tuned near to a spectral line. Here, the process known as anomalous dispersion leads to variations in the refractivity up to several orders of magnitude greater than non-resonant levels. Moreover, the refractivity varies in proportion to the number density of the species of interest so that quantitative measurements of the species number density can be obtained. To perform these measurements, it is possible to record one interferogram using light near resonance and a second interferogram off resonance and examine the difference to obtain the species concentrations. However, by using holographic techniques, only a single interferogram is required. This is achieved by using two lasers to simultaneously illuminate the flow, one near resonance and one off resonance. By recording both beams on a single holographic plate and reconstructing them with a third laser, the two beams overlap and interfere. The result is an interferogram which shows only species specific information - total density variations are present in both beams and thus are not observed in the interferogram.
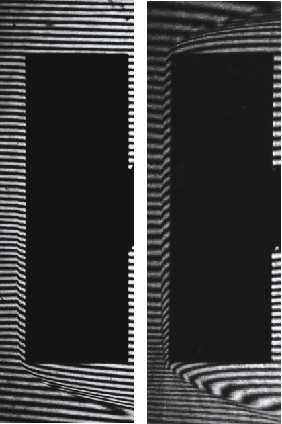
We have developed and applied near-resonant holographic interferometry to record the first such images of hypersonic flows. The adjacent pictures below show some results from experiments in the X2 expansion tube. The experimental layout used a single dye laserthat was tuned 100 pm from one of the sodium D lines. The flow was seeded with sodium by painting a salt solution on the upstream side of the final diagram. The sodium becomes entrained in the flow and allows enhanced sensitivity of the interferometric measurements. The image on the left shows an interferogram where only the lower half of the flow was seeded (due to gravitational effects on the seed solution). The enhancement is clear in that the bow shock can be observed where the sodium solution is present in the flow. The right image shows the full fringe shift for when the solution was properly seeded into the flow.

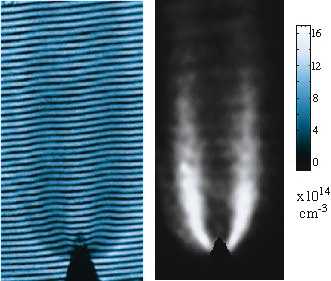
The technique can also be used to make quantitative measurements of species concentration. An example of this approach applied to measure OH concentration in a flame is shown adjacent. The images were recorded using two lasers, one near-resonant and the other non-resonant. These were combined and passed simultaneously through the flame. A sample interferogram is shown. Images were recorded at a variety of detunings and then analysed to yield the displayed OH concentration map. Flame temperature can also be obtained.